Decision tree
A decision tree is a flowchart that reaches an answer by asking one question at a time. This is a decision flowchart drawn by people, not a machine-learning model trained on data. It chooses a data store: files and media go to object storage, embeddings to a vector database or PostgreSQL, and records to PostgreSQL, a key-value store, a search engine or a data warehouse, depending on how the data will be read.
Engineers draw this to record a team’s default choices so the same argument is not repeated on every project, and to show a newcomer why the defaults are what they are. Several branches end at the same answer: PostgreSQL handles transactions and joins, has built-in full-text search, and can store vectors through an extension, so it is often the right choice even when the question started somewhere else. Data kept only for audit ends at object storage, the same place as files.
Mermaid source
---
title: Decision tree
---
flowchart TD
  start([Choose a data store]) --> kind{What is the data?}
  kind -->|Files and media| obj[(Object storage)]
  kind -->|Embeddings| vecfit{Already run PostgreSQL?}
  vecfit -->|Yes, modest volume| pg
  vecfit -->|No, or very large| vec[(Vector database)]
  kind -->|Records| access{Main access pattern?}
  access -->|Transactions and joins| pg[(PostgreSQL)]
  access -->|Lookup by key| hot{Sub-millisecond reads?}
  hot -->|Yes| kv[(Key-value store)]
  hot -->|No| pg
  access -->|Text search| product{Search is the product?}
  product -->|Yes| search[(Search engine)]
  product -->|No| pg
  access -->|Scans over history| who{Queried by analysts?}
  who -->|Yes| wh[(Data warehouse)]
  who -->|Kept for audit only| obj
Stock Mermaid vs Line9 on this decision tree
Run the same source through the stock Mermaid engine and it often will not look as good. In some cases, Mermaid is able to deliver a usable graph, but not always. On this one:
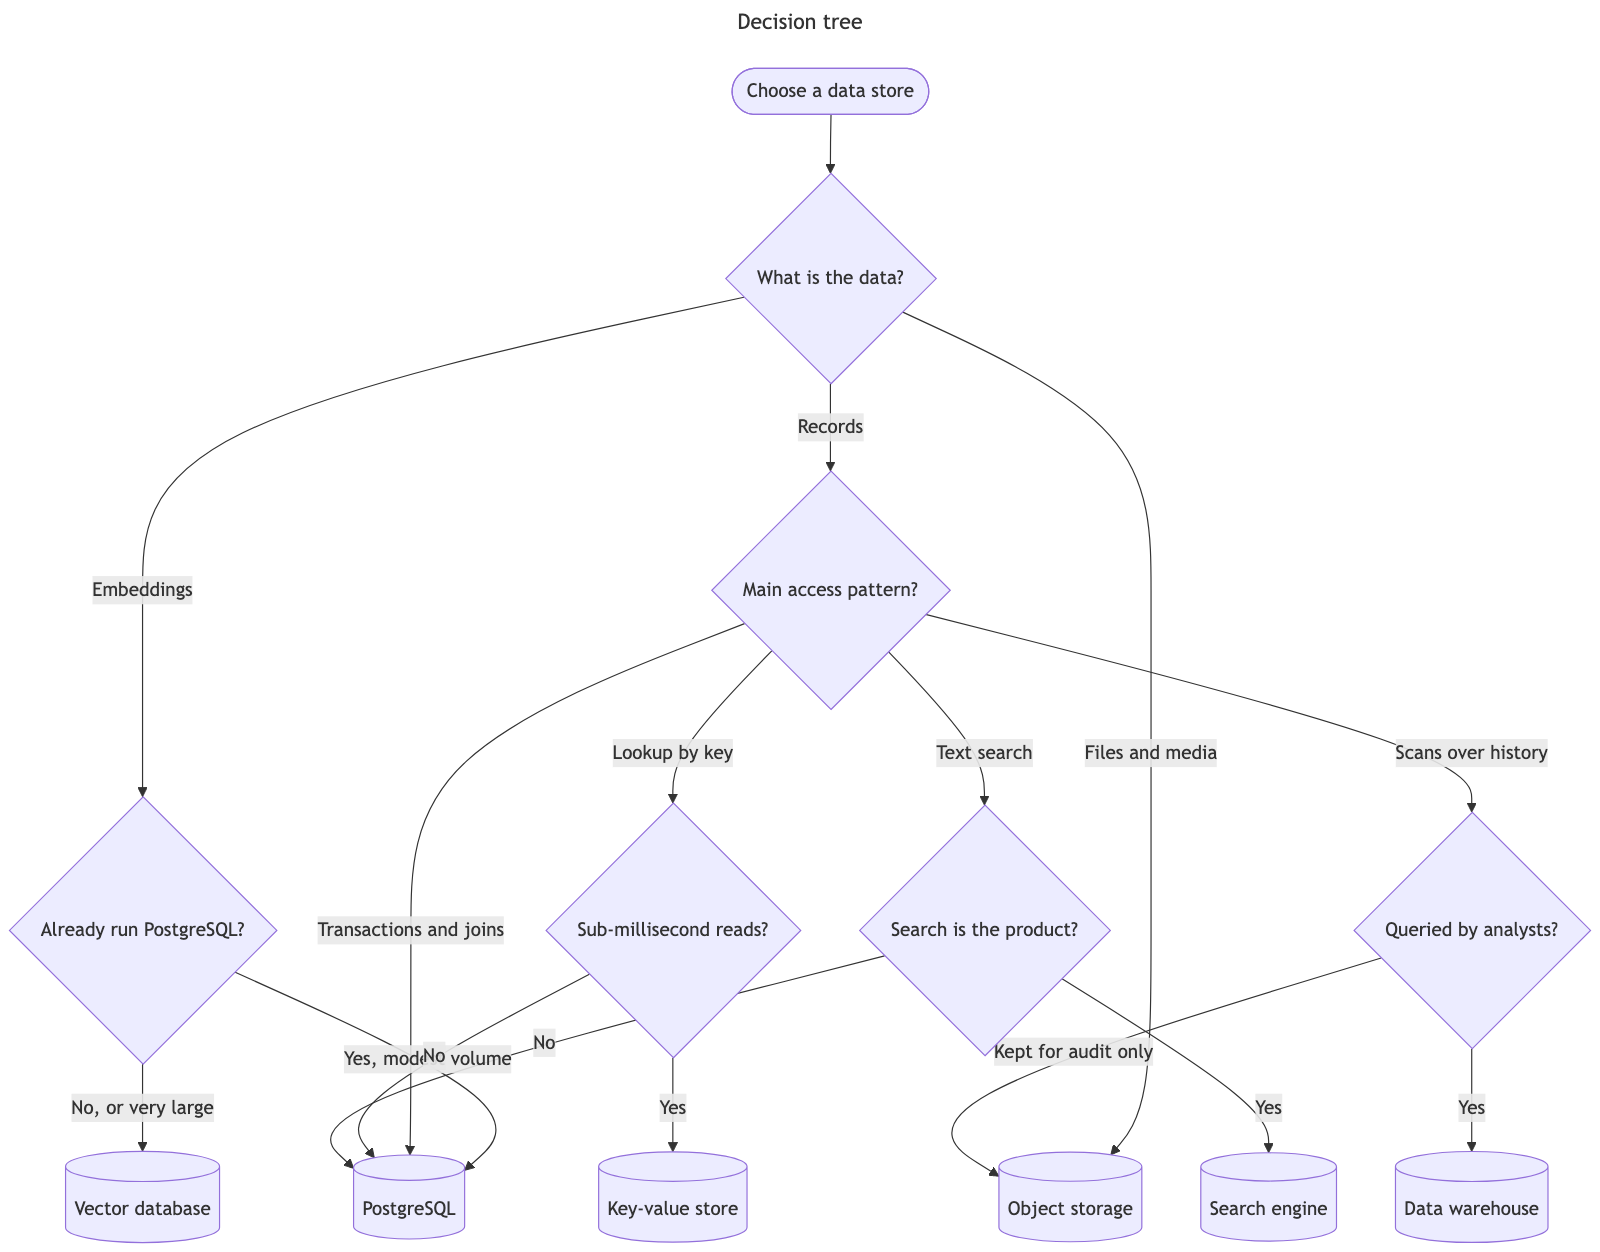
Stock Mermaid places all six answers in one row, which is a reasonable choice for this graph. The problem is the tangle of long curved edges that cross each other on their way down to those answers. Where they meet, the labels overwrite each other: “Yes, modest volume” and “No” print on top of one another and cannot be read. Line9’s version avoids the crossing edges entirely, and every label sits clearly on its own edge.
For a fuller product comparison — layout, export, CLI, and pricing — see Line9 vs mermaid.live.
Render your own
Paste any Mermaid flowchart into the free online editor — no account needed. Prefer the terminal? Install the line9 CLI (free for personal use).
Related diagrams
- User authentication flow (with MFA)
- GitHub pull request workflow
- CI/CD pipeline (with rollback)
- AI coding agent workflow
- Incident response runbook
- Database migration rollout
- Feature-flag canary rollout
- Webhook delivery, retry, and dead-letter flow
- Payment flow
- Content approval workflow (with legal review)
- Support ticket lifecycle
- Peer-review process
- Procure-to-pay process
- Recruitment process
- Kubernetes cluster architecture
- E-commerce order processing
- RAG application architecture
- Data flow diagram
- Network topology diagram
- System context diagram
- Event-driven architecture
- User flow diagram
- CONSORT flow diagram
- HACCP flow diagram
More scenarios on the Mermaid examples hub.