Network topology diagram
A network topology diagram shows the zones of a network and the paths traffic is allowed to take between them. Here, traffic from the internet passes an edge firewall into a DMZ holding a load balancer and two web servers, then an internal firewall into an application subnet, which alone reaches the data subnet with its primary database, read replica and cache. An office LAN and a VPN gateway for remote staff complete the picture.
Network and infrastructure engineers draw this to plan segmentation, to review firewall rules, and to show an auditor that the database cannot be reached directly from the internet. The DMZ sits between two firewalls so that a compromised web server still does not have direct access to the data. Administrators come in through the VPN to a single bastion host, so there is one place where admin access is controlled and logged.
Mermaid source
---
title: Network topology diagram
---
flowchart LR
  internet((Internet)) --> edge[Edge firewall]
  subgraph office [Office LAN]
    desks[Staff workstations]
    wifi[Office Wi-Fi]
    switch[Core switch]
  end
  desks --> switch
  wifi --> switch
  switch -->|outbound web| edge
  remote([Remote staff]) -->|encrypted tunnel| vpn[VPN gateway]
  edge --> vpn
  subgraph dmz [DMZ]
    lb[Load balancer]
    web1[Web server 1]
    web2[Web server 2]
    bastion[Bastion host]
  end
  edge --> lb
  lb --> web1
  lb --> web2
  vpn -->|admin access| bastion
  web1 --> inner[Internal firewall]
  web2 --> inner
  bastion --> inner
  subgraph appnet [Application subnet]
    api[API servers]
    workers[Background workers]
    reports[Reporting service]
  end
  inner --> api
  inner --> workers
  inner --> reports
  subgraph datanet [Data subnet]
    cache[(Cache)]
    primary[(Primary database)]
    replica[(Read replica)]
  end
  api --> cache
  api --> primary
  workers --> primary
  reports --> replica
  primary -. replication .-> replica
Stock Mermaid vs Line9 on this network topology diagram
Run the same source through the stock Mermaid engine and it often will not look as good. In some cases, Mermaid is able to deliver a usable graph, but not always. On this one:
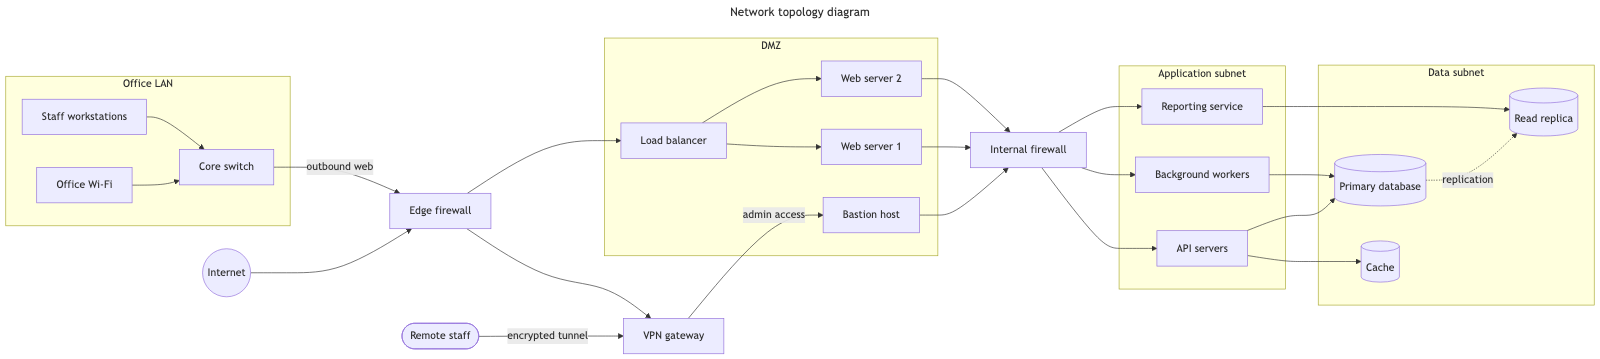
Stock Mermaid gives this network a reasonable layout, with the zones in a sensible order from left to right. It is about four times wider than it is tall, so to fit into a page or screen it has to be scaled down and its labels shrink. Line9 lays out the same source in a more compact shape, so it can be shown at a size where every label is readable.
For a fuller product comparison — layout, export, CLI, and pricing — see Line9 vs mermaid.live.
Render your own
Paste any Mermaid flowchart into the free online editor — no account needed. Prefer the terminal? Install the line9 CLI (free for personal use).
Related diagrams
- User authentication flow (with MFA)
- GitHub pull request workflow
- CI/CD pipeline (with rollback)
- AI coding agent workflow
- Incident response runbook
- Database migration rollout
- Feature-flag canary rollout
- Webhook delivery, retry, and dead-letter flow
- Decision tree
- Payment flow
- Content approval workflow (with legal review)
- Support ticket lifecycle
- Peer-review process
- Procure-to-pay process
- Recruitment process
- Kubernetes cluster architecture
- E-commerce order processing
- RAG application architecture
- Data flow diagram
- System context diagram
- Event-driven architecture
- User flow diagram
- CONSORT flow diagram
- HACCP flow diagram
More scenarios on the Mermaid examples hub.