Flowchart text - part 1
· 3 min read
I’ve been working on flowcharts for a while, obviously, and a few times recently I’ve shown one to Claude (AI), and it criticised how part of the diagram looked.
Well, of course, I wasn’t amused. In fact I told Claude straight, “You’ve got it wrong. I see that problem in all flowcharts – it’s a universal problem and no-one fixes it because it’s unfixable. It’s clearly limited by the geometry”.
And then one day last week it hit me. Claude was right! It can be fixed. So I set to work and several hours later it was done. Now Line9 is better at this than almost all other diagramming tools.
Claude’s complaint
The problem that Claude kept mentioning was the text size in my diamonds. It said the font was too small. Take a look at how Line9 used to draw and you’ll probably agree with Claude:
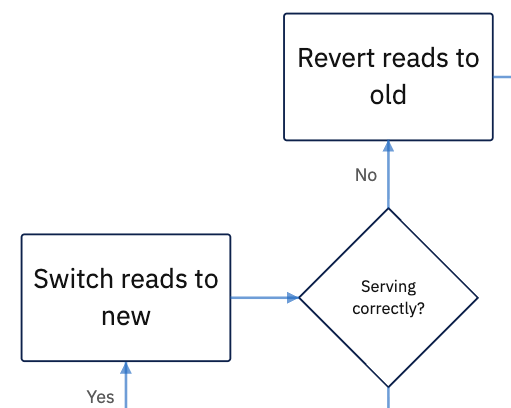
Why didn’t I accept Claude’s criticism? Well, I’d learned from experience that writing more than a couple of words into a diamond often results in a mess. Look at these examples from some other popular tools:
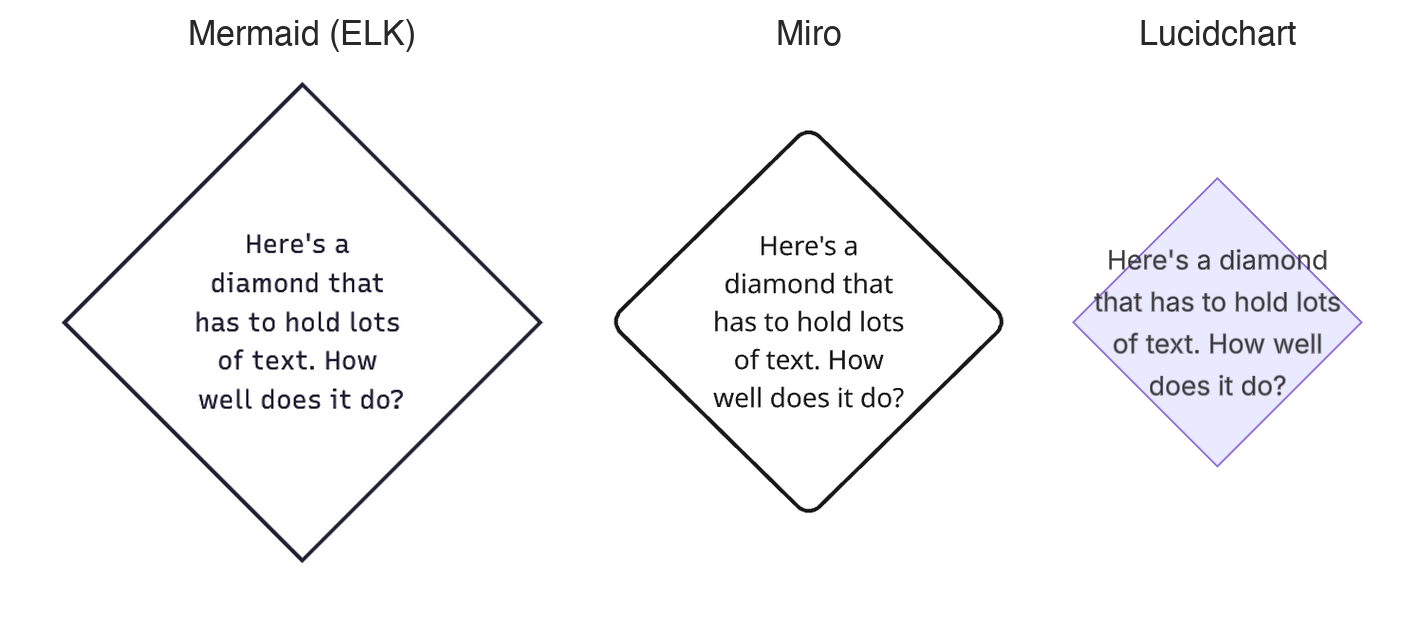
Text areas are rectangular by default. If you use that standard shape when putting text into a diamond, then you have two choices:
- keep the rectangle inside the diamond (e.g. Mermaid and Miro) – your diamond has to be enlarged to make it fit
- make the rectangle big enough to hold your text (Lucidchart) – the text runs over the diamond’s edges.
Both of these are bad. But because of Claude’s persistent complaints, I realised they weren’t the only alternatives.
The best way to write text inside a diamond was to address the actual problem. Don’t use a rectangular text area – use a diamond-shaped one instead. This may sound obvious, but it’s rarely done because it takes more work and quite a lot of thinking. Nonetheless, Line9 now arranges its text to fit the shape. It’s another fine detail that raises Line9’s quality of drawing above the ordinary.
Shapes in flowcharts
Diamonds are the most commonly used flowchart shape after rectangles. Although only 5% of nodes are diamonds, they’re used in 18% of all flowcharts. My survey of 500 public GitHub flowcharts shows:
| Shape | % of Nodes |
|---|---|
| Rectangle (square or rounded) | 88 |
| Diamond | 5 |
| Cylinder | 3 |
| Stadium | 2 |
| All other shapes | 2 |
Diamonds are therefore the most important shape whose text arrangement needed improvement. But others, such as circles, stadiums and triangles, also benefit. Now that I’ve fixed this in Line9, I love using more varied shapes in my flowcharts.
The benefit of shaping text isn’t only cosmetic. Consider the situation where you want to display a complex diagram on a single page. It often has to be scaled down to make it fit, but scaling a diagram down means the text becomes too small to read.
So there’s a practical benefit in packing text efficiently into the available space. It allows shapes to be a little bit smaller. Smaller shapes mean fitting more into a page whilst keeping everything legible.
Line9 vs. other tools – same shapes and labels
It’s interesting that many common diagramming tools have ignored this problem. I intend for Line9 to be a better alternative, rethinking and improving how you draw diagrams. Here’s a comparison of Line9 and several other tools (as of November 2026) showing how they shape text.
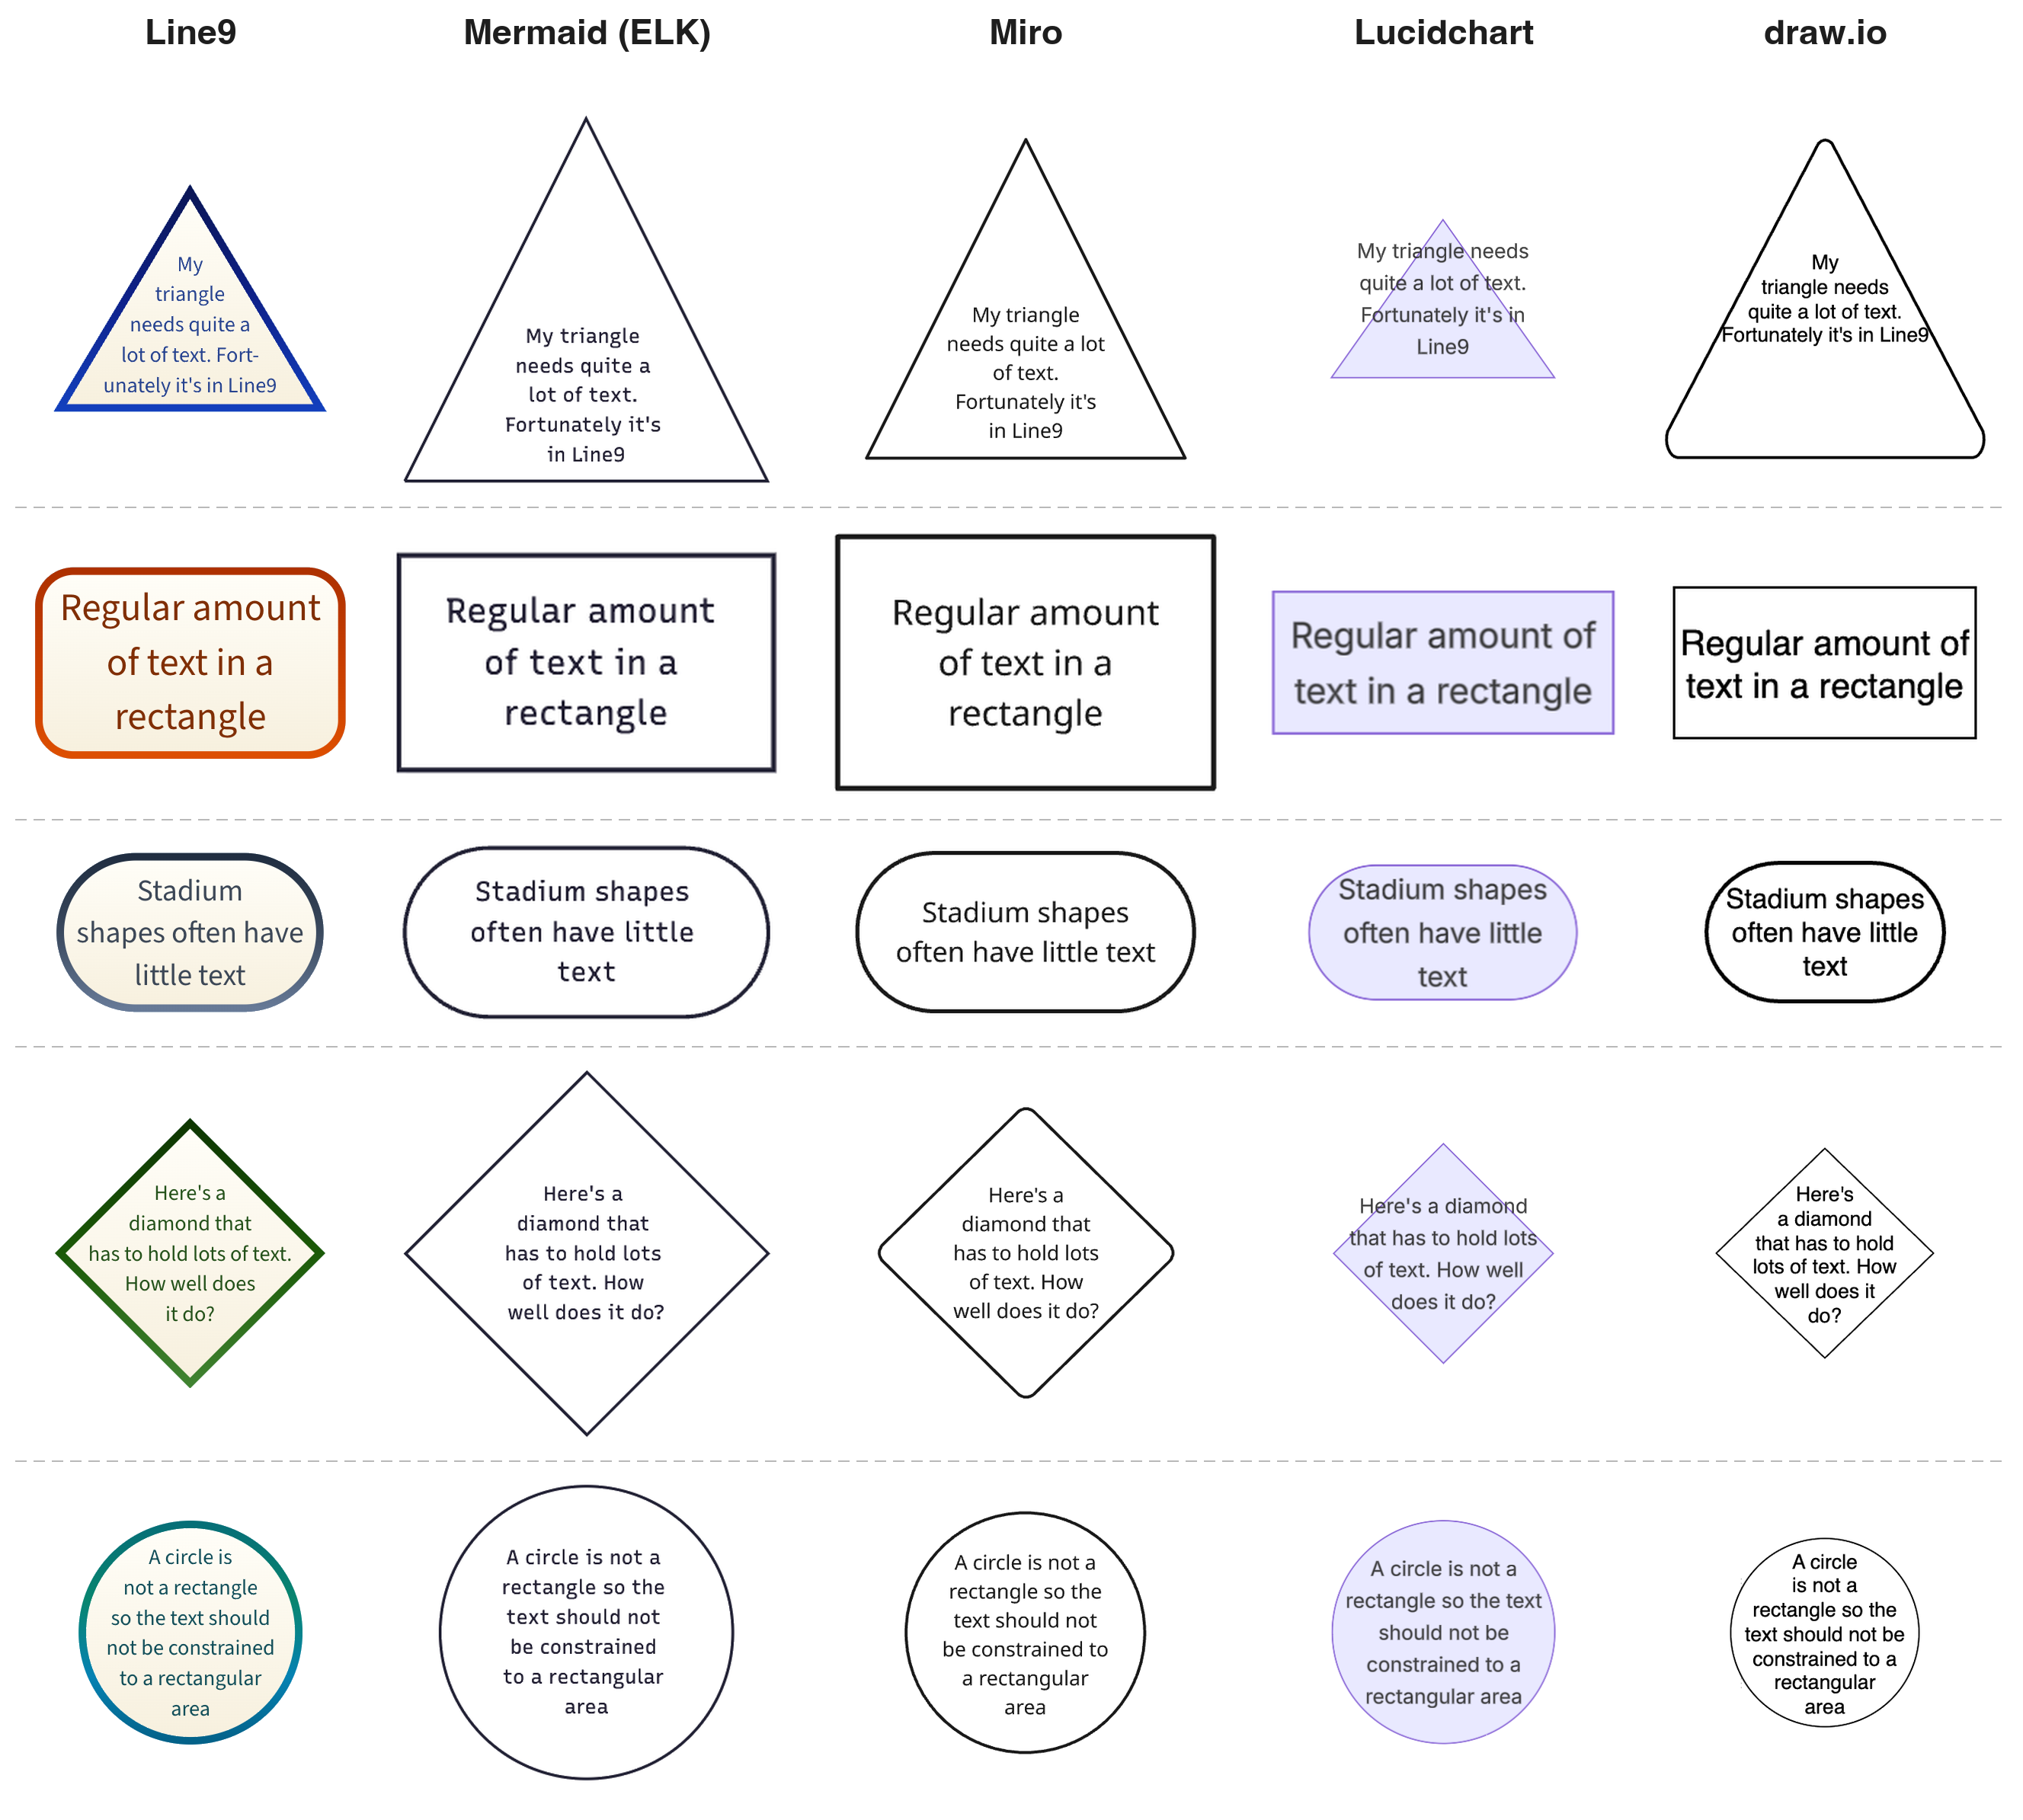
As you can see, Mermaid, Miro and Lucidchart all use rectangular text areas and as a result their shapes typically need to be drawn larger than in Line9. Lucidchart often expands the text outside the shape’s boundary, so the shape can be small but the result is untidy. draw.io actually does a good job. It clearly arranges text to fit neatly inside different shapes, although the triangle falls short. Whilst Line9’s shapes are of a fixed size, they now display larger text where possible and truncate less often.
Copy your own flowchart into Line9 now and see for yourself the difference that it makes.